Simplify statistical predictions with our Poisson Distribution Calculator. Make data analysis straightforward for precise event probability calculations
RESULTS
The Poisson Distribution Calculator is a user-friendly tool designed to help you work with the Poisson Distribution, a fundamental concept in probability theory. In this guide, we’ll provide a concise overview of the Poisson Distribution, and its significance, and introduce you to the key features of our user-friendly calculator.
Poisson Distribution
The Poisson distribution is a fundamental concept in statistics and is widely used in various fields, from physics to the social sciences. It is a discrete probability distribution that describes the number of successes in a fixed time interval, given that the events are independent and identically distributed. The Poisson distribution is characterized by its mean (λ) and standard deviation (σ), which are related to the average rate of success (λ) and the variance (σ^2) of the underlying Bernoulli process.
Understanding and Calculating Poisson Distribution
Understanding and calculating Poisson distributions is crucial for various reasons:
- Modeling discrete events: Poisson distributions can be used to model the number of discrete events occurring within a given time interval, making it a versatile tool for analyzing phenomena in diverse fields.
- Probability assessment: Poisson distributions allow for the calculation of probabilities associated with specific numbers of successes, which is essential for making informed decisions and predictions based on limited data.
- Error analysis: In scientific experiments, Poisson distributions can be used to analyze the number of errors made by experts, providing insights into the reliability and accuracy of their work.
- Resource allocation: Poisson distributions can help in the allocation of resources, such as determining the optimal number of personnel needed to achieve a specific goal or the probability of a particular outcome occurring within a given time frame.
Poisson Distribution Calculator
Our Poisson Distribution Calculator is designed to help users compute individual and cumulative Poisson probabilities, making it an invaluable tool for various applications. The calculator uses λ (average rate of success) and X (poisson random variable) to calculate the probability distribution, probability distribution percentage, cumulative distribution, and cumulative distribution percentage. Users can input their data and receive accurate results, allowing them to make informed decisions and predictions based on the Poisson distribution.
Poisson Distribution Calculator Parameters
Average Rate of Success (λ)
The average rate of success (λ) is a key parameter in the Poisson distribution, representing the expected number of successes in a fixed time interval. It is a measure of the underlying rate of occurrence of the events being modeled and is used to calculate the probability of observing a specific number of successes in a given time frame.
Poisson Random Variable (X)
The Poisson random variable (X) is the number of successes observed in a fixed time interval. It is a discrete random variable that takes on non-negative integer values and is characterized by the Poisson distribution.
Features of Poisson Distribution Calculator
Our Poisson Distribution Calculator offers a range of features to help users compute and interpret Poisson probabilities with ease and accuracy. From calculating the probability of observing a specific number of events to determining cumulative probabilities, the calculator provides valuable insights for a variety of applications. Let’s explore the key features of the Poisson Distribution Calculator in detail.
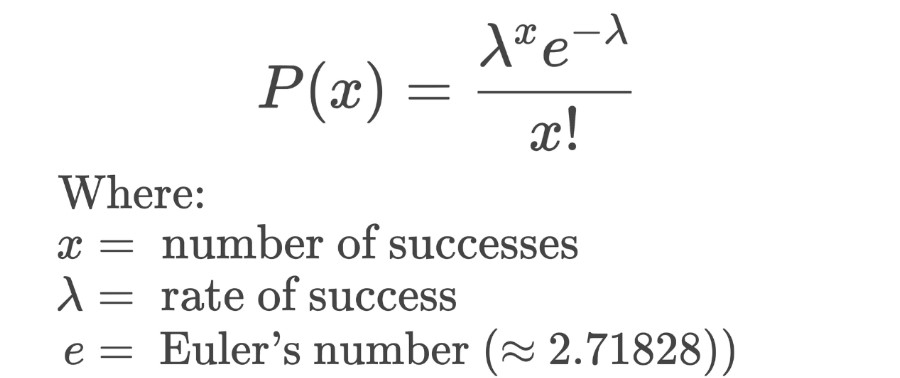
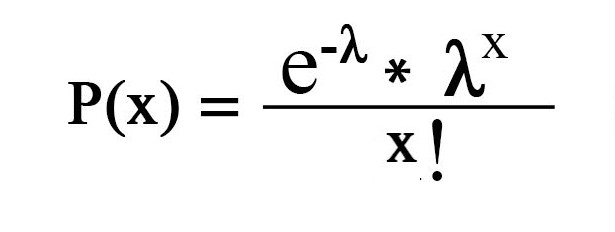
Poisson Distribution
Formula:
Our Poisson Distribution Calculator computes the probability of observing exactly X events in a fixed time interval using the formula provided above. Users can input the value of λ and the desired value of X, and the calculator will display the corresponding probability.
Poisson Distribution %
The calculator converts the computed probability into a percentage, making it easier for users to understand and interpret the results. Users can view the probability of observing exactly X events as a percentage, along with the other probabilities calculated by the calculator.
Cumulative Distribution
Formula:
The calculator computes the cumulative probability of observing up to X events in a fixed time interval using the formula provided above. Users can input the value of λ and the desired value of X, and the calculator will display the corresponding cumulative probability.
Cumulative Distribution %
The calculator converts the computed cumulative probability into a percentage, making it easier for users to understand and interpret the results. Users can view the cumulative probability of observing up to X events as a percentage, along with the other probabilities calculated by the calculator.
How to Use the Poisson Distribution Calculator
Ensure accurate calculations and insightful results by following these straightforward steps for entering values:
- Average Rate of Success (λ):
- Locate the designated field for the Average Rate of Success (λ).
- Input the average rate of success, representing the expected number of events in the given interval.
- Experiment with different λ values to observe their impact on the distribution.
- Poisson Random Variable (X):
- Navigate to the input field for Poisson Random Variable (X).
- Specify the exact number of events you’re interested in within the defined interval.
- Tailor X to your specific analysis, accounting for the variability in your scenario.
Understanding Each Calculated Result
Decode the significance of each calculated result to gain a comprehensive understanding of your probability distribution.
- Poisson Distribution:
- Interpret the probability mass function, revealing the likelihood of precisely X events occurring.
- This result provides a granular understanding of the probability associated with your chosen Poisson random variable.
- Poisson Distribution %:
- Witness the conversion of the probability into a percentage format for easy interpretation.
- This percentage representation offers a quick and intuitive grasp of the likelihood of the targeted event’s occurrence.
- Cumulative Distribution:
- Grasp the cumulative probability of observing up to X events.
- Use this holistic perspective to comprehend the broader probability landscape and potential cumulative outcomes.
- Cumulative Distribution%:
- Similar to the Poisson Distribution %, this provides a percentage representation of the cumulative probability.
- Gain insights into the overall likelihood of observing a certain number of events or fewer within the defined interval.
Illustrating Usage with Example Scenarios
Deepen your understanding of the calculator’s functionality through real-world examples:
- Example 1: Customer Arrivals
- Imagine managing a service center and predicting the probability of a specific number of customers arriving in the next hour. Adjust λ and X to fit your scenario and interpret the outcomes for strategic decision-making.
- Example 2: Equipment Failures
- In an industrial setting, understand the likelihood of a certain number of equipment failures within a specified timeframe. Adjust λ to reflect the average failure rate and set X to plan maintenance effectively.
By following these instructions and exploring example scenarios, you’ll navigate the Poisson Distribution Calculator with confidence, unlocking its potential for informed decision-making and statistical analysis.
Frequently Asked Questions:
1. Can I use the Poisson Distribution Calculator for financial forecasting?
Certainly! The Poisson Distribution Calculator is versatile and can be applied to financial scenarios. For instance, you might use it to predict the number of financial transactions or customer interactions within a fixed timeframe, aiding in budgeting and resource allocation.
2. Can the calculator assist in predicting equipment downtime in manufacturing?
Indeed. By inputting the average rate of equipment failures (λ) and specifying the number of failures you’re interested in (X), the calculator can help predict the probability of downtime, aiding in maintenance scheduling and reducing production disruptions.
3. Can the calculator handle large datasets or complex scenarios?
The calculator is designed to handle a wide range of scenarios, but it’s important to keep in mind that the accuracy of results may be influenced by the nature of the data and the appropriateness of the Poisson distribution model for your specific case.
Related Calculators: