With our easygoing calculator, you can easily find out the sample standard deviation and population standard deviation. Apart from showing the standard deviation, our tool also shows the value of variance, mean, sum, and their difference. Just follow the steps mentioned on the calculator and you will be good to go!
RESULTS
Population
Sample
What Is Standard Deviation?
Standard deviation is a number that tells you how spread out numbers are in a group. Think of it like measuring how different each number is from the average, or mean. If all the numbers in a data set are close to the mean, then the standard deviation will be small. In other words, the standard deviation is the square root of the variance of any statistical data set.
To understand standard deviation well, picture your friends’ heights: if most of them are about the same height as each other, they have low standard variation. Now imagine some friends are very tall and others really short; this means there’s a high standard variation in their heights.
So, standard deviation helps us see whether something changes a lot or just a little bit from what’s normal.
Formula Of Standard Deviation
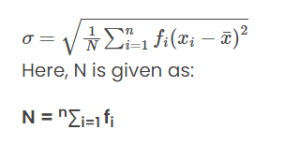
Notations For Standard Deviation:
- σ = Standard Deviation
- xi = Terms Given in the Data
- x̄ = Mean
- n = Total number of Terms
How To Calculate Standard Deviation
Calculating standard deviation is like finding out how many numbers in a list dance around their average. It shows us if they stick close together or spread far apart.
- First, write down all the numbers you have. These could be scores, measurements, or any kind of data.
- Add these numbers together and divide by how many numbers there are. This is your mean (average).
- Now take each number in your list and subtract the mean from it. This tells you how far each number is from the average.
- Next, square each of these differences. That means multiplying them by themselves.
- After that, add up all of these squared numbers.
- Then divide this total by one less than your number count if you’re working with a sample, not the whole group. If you’re using all possible data, just use your original count. This step gives you a variance.
- Last step: Take the square root of that variance number to find your standard deviation.
- Always make sure you are using correct numbers for accurate results.
- A calculator can help do these steps fast and without mistakes.
- Understanding standard deviation lets you know more about your data’s story—whether it’s reliable or has lots of ups and downs.
Importance of Standard Deviation
Understanding the concept of standard deviation unlocks a deeper comprehension of data, giving us powerful insight into its variability and consistency. It’s a statistical tool that informs decision-making across various fields by shedding light on the spread and reliability of data points within a dataset.
1. Understanding Variability
Variability shows us how spread out numbers in a group are from the average. Think about when you and your friends take tests, some scores might be high, others low, but most will be around the middle.
That’s like variability; it gives us a peek at how different each score is. When there is high variability, scores are all over the place. But if it’s low, then everyone did more or less the same.
Knowing about variability can make you smart with numbers. It can tell you if something strange happened during an experiment or see if a stock price moves too much for comfort. You use this info to guess what might happen next time based on past facts – that’s super useful in science projects or when planning to save money!
2. Identifying Outliers
Understanding how spread out your numbers are is one step, but sometimes you need to find the odd ones that don’t fit. Outliers stick out because they’re not like the rest of the data.
They can be way higher or lower than other values. A standard deviation calculator helps spot these weird numbers quickly.
3. Comparing Data Sets
Comparing data sets tells us how they are different or similar. You can look at two groups of numbers and see which one spreads out more or which one is tighter together. Standard deviation helps with this. It’s like a ruler for measuring how spread out the numbers are in each group.
Imagine you have test scores from two classes. If you want to know which class has scores that are all over the place, standard deviation will give you the answer. Use it to find out if Class A has most students scoring close to the same number while Class B’s scores jump up and down a lot.
Now let’s think about using a calculator for standard deviation. It makes things faster and keeps mistakes low. Plus, it’s easy; just put your numbers in, click a button, and get your answer! Next up, we’ll look at why these calculators make life easier when working with standard deviation.
Benefits of Using a Standard Deviation Calculator
There are a lot of benefits to using our standard deviation calculator. Here are all of them!
1. Time-Saving
Our standard deviation calculator is a great tool that helps you get your math homework done fast. You just punch in your numbers and boom—you have the answer. Forget about adding, subtracting, and dividing all those numbers by yourself for hours. This smart calculator does it super quick.
With this calculator, you can easily find out how much your numbers spread out from the average—really handy for science projects or when you’re checking grades. And because it’s so speedy, you’ll have more time to hang out with friends or play games! Ready to see how well your data matches up? Let’s move on to the next point: accuracy.
2. Accuracy
Getting numbers right matters, especially when it’s about standard deviation. A standard deviation calculator helps you make sure your answers are spot on. It takes away the chance of small mistakes happening if you were doing the math by hand.
When dealing with things like test scores or research data, even a tiny error can throw off your whole work.
Using this tool means relying on its precision to give the right value for either population or sample standard deviation every time. You trust it to handle complex calculations and long formulas quickly and without slip-ups.
It’s built to be accurate, so students like you can focus more on understanding your results than worrying about whether they’re correct.
3. Ease of Use
A standard deviation calculator makes your math work much easier. Instead of doing lots of complex sums by hand or in your head, this handy tool does it fast and without mistakes. You just put in your numbers – maybe it’s scores from a test or measurements like the length of leaves – and click a button.
It quickly tells you how spread out your numbers are around the average.
This calculator is super useful for homework, science projects, or figuring out stuff like price changes in finance. It helps you understand things better because it works with all sorts of data sets big or small.
Now that we’ve seen how simple it is to use a standard deviation calculator, let’s dive into why knowing about variability matters so much.
FAQs
Question: Why Do People Use Standard Deviation In Statistics?
People use standard deviation to tell if their data has big differences or if most of it is close to the average (sample mean). This helps them understand things better, like test scores or temperatures.
Question: Can I Find Out The Population Standard Deviation With This Calculator?
Yes, you can calculate the population standard deviation using all the numbers from everyone or everything you’re studying.
Question: What Does Sample Variance Mean?
Sample variance measures how far away each number in your small group (sample) is from its average value and then squares those differences.
Question: How Does Bessel’s Correction Work In Calculating Standard Deviation?
Bessel’s correction fixes the calculation when you only look at some of your data instead of everything, making sure what you get for the spread isn’t too small.
Question: Does Knowing About Spreadsheets Help Me With Using A Standard Deviation Calculator?
Yes! If you know spreadsheets, they have functions that let you put in your numbers and automatically calculate things like sample size, averages, and even your needed margin of error.