Effortlessly calculate your ending inventory with our user-friendly tool. Streamline your inventory management and make informed business decisions
RESULTS
Struggling to get a clear picture of your inventory levels at the end of the accounting period? Effective inventory management is crucial for businesses looking to optimize profitability.
This guide will provide a lifeline for those wrestling with complex inventory calculations, introducing an intuitive ending inventory calculator designed to streamline your stock-taking process.
What is Ending Inventory?
Ending inventory represents the value of goods that a company still has on hand at the end of an accounting period, which is crucial for understanding both financial health and stock management dynamics.
It’s the remaining pulse of merchandise awaiting its journey from shelf to sale, providing insight into what was sold, and what remains, and informing future purchasing decisions.
Definition of Ending Inventory
Ending inventory is the value of goods that a company still has at the end of a period. It includes all the products ready for sale and those partly made. To find out how much ending inventory there is, you add up the cost of everything not sold yet.
This amount is very important because it tells you what’s left and helps to understand profits.
Businesses count their ending inventory often, usually at year’s end, to see how much they have. They use this number to figure out costs of goods sold (COGS) on financial statements like income statements and balance sheets.
Knowing your ending inventory helps keep track of what’s selling well and what’s not, guiding future buying choices. It also plays a big role in paying taxes correctly since it affects business income numbers. Simplify your tax calculations with our GST Calculator, computing Goods and Services Tax effortlessly.
Here’s a simple table representing the calculation:
| Component | Amount |
|---|---|
| Beginning Inventory | $10,000 |
| Purchases | $20,000 |
| Cost of Goods Sold | $15,000 |
| Ending Inventory | $15,000 |
Components of Ending Inventory Calculator
Understanding the building blocks of an ending inventory calculator is crucial—dive into the nuances of opening inventory, net purchases, and cost of goods sold to master your stock levels and maintain financial health.
Opening Inventory
Opening inventory is what you have left over from the last time you checked your stock. It’s all the goods that were not sold before. Think of it like the starting line for a race—it’s where you begin when counting what you’ve got now.

You must know your opening inventory to manage your business well. It helps you figure out how much new stuff you need to buy and tells you about money tied up in stuff that’s just sitting around.
Keep track of this number, so everything else adds up right?
Net Purchases
After you’ve looked at your opening inventory, it’s time to consider net purchases. This is the total amount of goods you have bought for your business during a certain period. It includes both items you’ve already paid for and things you will pay for later.
Formula

You must add up all the money spent on these new items to get an accurate number.
This part also takes into account any discounts or returns that might affect what you actually spend on inventory. Let’s say you buy products at lower prices or return some goods because they’re not right; this lowers your total cost.
So, make sure to subtract any discounts and returned goods from your total purchases to find out the real amount of money used in buying new stock for your store or company. This step is key in figuring out how much stuff you have at the end of a period and helps keep track of spending too!
Cost of Goods Sold (COGS)
Cost of Goods Sold (COGS) is a key part of inventory management. It’s the total cost to make or buy the products your business sells. This includes things like materials and labor to create a product, but not indirect expenses like marketing or shipping.
Formula
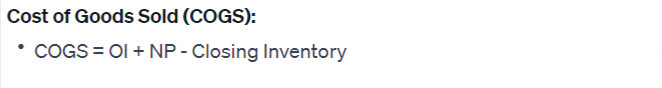
To find out how much money you made, you need to know COGS. Take away COGS from your sales revenue, and you see your gross profit—the money left over after paying to get goods ready for sale.
Keeping track of COGS helps businesses set prices right and see where they can cut costs.
Formula for ending inventory
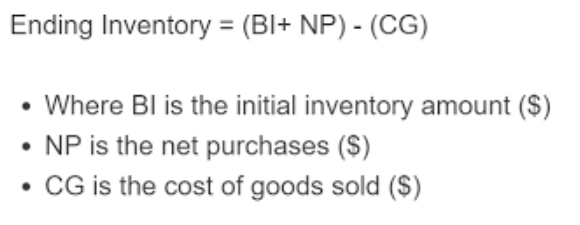
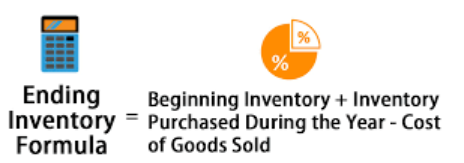
To find out how much inventory you have left at the end of a period, there’s a simple formula to use. You start with the opening inventory, which is what you had available at the beginning.
Then you add any new purchases made during that time. Finally, subtract the cost of goods sold (COGS) from this total. This will give you your ending inventory value.
Opening Inventory + Net Purchases – Cost of Goods Sold = Ending Inventory
This number is crucial because it tells you what’s still on hand that can be sold to customers. It impacts your business reports and tax filings too. Make sure all numbers are accurate before using our calculator for fast results.
With the correct values in place, moving on to calculate other important figures like inventory turnover becomes much easier. Now you can also analyze your financial health with our Debt to Asset Ratio Calculator, assessing your company’s debt management.
Step-by-Step Guide For Using Our Calculator
Discover the ease of inventory management with our user-friendly Ending Inventory Calculator, a tool designed to streamline your accounting process. Navigate each step confidently as you input key figures and let the calculator efficiently work out your ending inventory and turnover rate—empowering you to make informed decisions for your business’s financial health.
- To calculate the beginning inventory, the user needs to enter the value for the beginning inventory in the beginning inventory field. Start by typing in how much beginning inventory you have.
- Get ready to add more information to other boxes to see your ending inventory take shape.
- Next, the user needs to enter a value for net purchases into the net purchases field. Enter your net purchases next. This is the total cost of all items you bought to sell during a period, minus any returns or discounts you received.
- You take what you started with, add what you bought, and subtract what you sold to find this number.
- Then the user needs to enter a value for the cost of goods sold into the cost of goods sold field. It’s time to add the cost of goods sold (COGS) amount. This is a key step because COGS tells us how much money was spent to make the products that were sold.
- Type this number into the Cost of Goods Sold field on our calculator. Make sure you take care of this part. Getting it right means your ending inventory calculation will be accurate too. Double-check your numbers if you need to; these details are important for your business records and tax reports.
- After entering all of the values, the user needs to hit the calculate button to calculate the beginning inventory. Once you’ve filled in the required numbers, it’s time to find out your starting inventory. Just press the calculate button.
- With this tool, managing your inventory becomes a breeze. You’ll know exactly what you started with before adding any new purchases or sales to the mix. This helps keep your records straight and makes planning much easier.
Example
Let’s say you run a small business that sells handmade soaps. At the start of the year, your shelves were stocked with $5,000 worth of soap. During the year, you bought more materials and made new soaps that cost you $2,000.
You sold lots of soap and figured out the cost was $3,000 worth of your products. Pop those numbers into our ending inventory calculator—it’s easy! Just type in $5,000 for opening inventory, add $2,000 for net purchases, and put in $3,000 for cost of goods sold.
Push “calculate,” and there you have it! You’ll see how much soap is left on your shelves at year-end without having to guess.
Or imagine this: You own a clothing store with many jeans at the beginning valued at $10,000. Over time, you buy more jeans for your shop, totaling up to $5,000, while selling some as well, which costs around $4,500 worth of stock compared to what was initially there.
Enter these figures into our handy tool in their respective fields, hit “calculate,” and then immediately get results showing how much denim is still waiting for customers by closing time on December 31st—no sweat involved! It helps track everything accurately, so making decisions about sales or orders next season becomes way simpler.
Examples of Ending Inventory Calculations
| Method | Formula (using sample data) | Ending Inventory |
|---|---|---|
| Basic | $10,000 + $15,000 – (20,000 * (1 – 0.30)) | $5,000 |
| Retail Inventory | ($15,000 / 0.75) – ($20,000 * (1 – $5,000)) | $5,000 |
| Gross Profit | $10,000 + $15,000 – (20,000 – 6,000) | $5,000 |
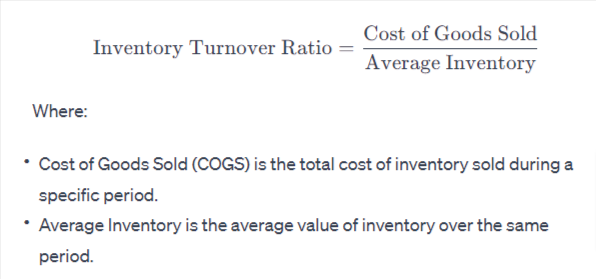
Understanding Inventory Turnover
Grasping the concept of inventory turnover is pivotal—it’s a metric that reflects the rate at which your company’s inventory is sold and replaced over a period, signaling the efficiency of sales and inventory management; let this be your gateway to mastering your stock levels and optimizing business performance.
Definition of inventory turnover
Inventory turnover tells you how fast a company sells its goods. It’s like a speedometer for sales. If the number is high, it means products fly off the shelves quickly. A low number could mean items sit too long before they’re sold.
This figure helps businesses make better choices about buying new stock and pricing their items.
Understanding inventory turnover is key to keeping cash flow smooth and making sure there’s always enough on hand—but not too much! It guides managers in planning what to order and when to order it, impacting everything from storage costs to satisfying customers’ needs.
Let’s dive deeper into why this matters with the components of ending inventory calculations next. Now you can also Plan your financial future with our handy ANC Calculator, helping you determine accumulated net capital.
The importance of inventory turnover
Knowing how fast a business sells and replaces its stock is key. This speed is what we call inventory turnover. High turnover means selling goods quickly, which often leads to less money tied up in stock.
| Component | Amount |
|---|---|
| Beginning Inventory | $10,000 |
| Ending Inventory | $15,000 |
| Average Inventory | $12,500 |
| Cost of Goods Sold | $60,000 |
| Inventory Turnover Ratio | 4.8 |
It also points to strong sales or effective buying practices.
A low turnover can signal overstocking or weak sales. This might mean the business has too much money stuck in inventory, which isn’t good. It’s like having cash locked away where it can’t be used for other important things in the company.
Keeping an eye on inventory turnover helps a business stay smart about what and how much to buy, keeping shelves fresh and customers happy without wasting resources.
Types of Inventory Valuation Methods
In the ever-evolving landscape of inventory management, mastering the various valuation methods—critical tools for calculating costs and profits—is essential. With techniques like FIFO, LIFO, and WAC at your disposal, you’ll be well-equipped to optimize your inventory strategy and stay financially informed.
FIFO (First In, First Out)
First In, First Out, or FIFO, is a way to value inventory that assumes the items you bought or made first are sold first. Think of it like a line at the grocery store where the first person in line checks out first.
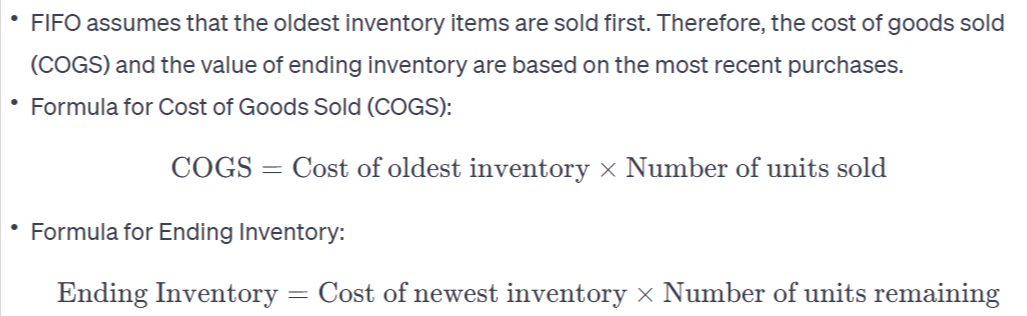
This method is really helpful when prices change often because it can affect how much profit a company reports. When using FIFO during times when costs go up, businesses might show higher profits because they sell older items with lower production costs.
FIFO isn’t just popular for its simplicity; it also reflects real-life practices used by lots of companies. For example, food businesses use FIFO to make sure they sell older products before they go bad, keeping everything fresh for customers.
This approach keeps your inventory tidy and helps prevent waste—a win-win for both shopkeepers and shoppers!
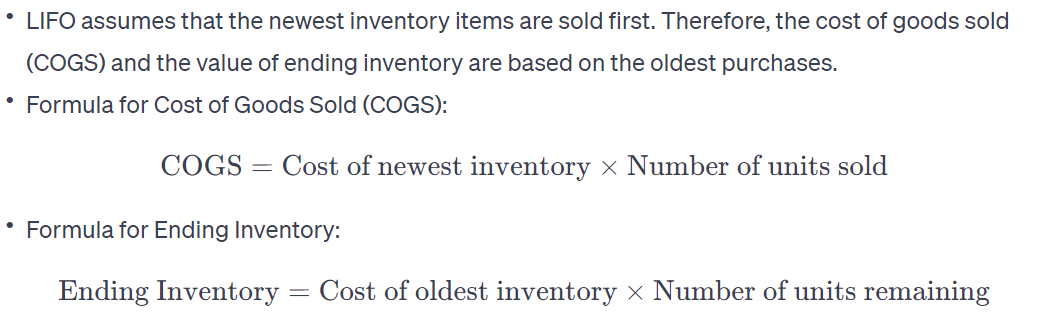
LIFO (Last In, First Out)
LIFO stands for Last In, First Out. It’s a way to value inventory that assumes the most recent items you bought or made will be the first ones sold. Many companies use LIFO because it can help match current sales with current costs during times when prices are going up.
This means if you sell something, the cost of what you just bought is considered as the cost of goods sold. As a result, this can lower your profit on paper in times of rising prices and potentially reduce taxes.
Imagine a shelf filled with boxes. With LIFO, when a new box arrives, it goes on top and becomes the first one you’d take down to sell. This method is important in business strategy and helpsmanage cash flow effectively.
But remember, not all countries allow the use of LIFO accounting; some places require other methods like FIFO (First In, First Out) or WAC (Weighted Average Cost).
WAC (Weighted Average Cost)
Weighted Average Cost, or WAC, is a way to figure out the cost of your inventory. Imagine you have different batches of goods bought at various prices. Instead of tracking each price separately, WAC mixes them all up to find one average cost. This helps when you sell items because it makes it easier to know how much money you make.
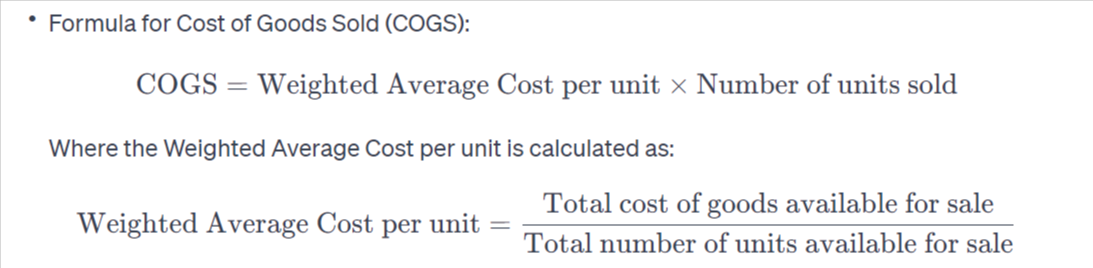
Businesses like using WAC because it smooths out price changes over time. If costs jump around a lot, this method can keep things steady for accounting. It’s fair and simple: just add up all the costs and divide by the number of items you have.
This gives each item the same value in your books and can help you make smart choices about pricing and profits.
FIFO (First-In, First-Out):
| Date | Units Purchased | Cost per Unit | Total Cost | Units Sold | COGS (at Cost) | Ending Inventory (at Cost) |
|---|---|---|---|---|---|---|
| 01/01/2023 | 100 | $10 | $1,000 | – | – | 100 |
| 03/01/2023 | 150 | $12 | $1,800 | – | – | 250 |
| Totals | 250 | $2,800 |
LIFO (Last-In, First-Out):
| Date | Units Purchased | Cost per Unit | Total Cost | Units Sold | COGS (at Cost) | Ending Inventory (at Cost) |
|---|---|---|---|---|---|---|
| 01/01/2023 | 100 | $10 | $1,000 | – | – | 100 |
| 03/01/2023 | 150 | $12 | $1,800 | – | – | 250 |
| Totals | 250 | $2,800 |
Weighted Average Cost (WAC):
| Date | Units Purchased | Cost per Unit | Total Cost | Units Sold | COGS (at Cost) | Ending Inventory (at Cost) |
|---|---|---|---|---|---|---|
| 01/01/2023 | 100 | $10 | $1,000 | – | – | 100 |
| 03/01/2023 | 150 | $12 | $1,800 | – | – | 250 |
| Totals | 250 | $2,800 |
In each table, the “Units Sold” column represents the number of units sold during the accounting period, and the “COGS” column represents the cost of goods sold based on the respective method. The “Ending Inventory” column shows the value of the remaining inventory at the end of the period.
Knowing your ending inventory matters a lot. It’s like checking how much food you have before you go to the store. You take what you started with, add what you bought, and take away what you sold.
Our calculator helps make this easy.
Are you ready to see how it can help your business? Think of all the time and mistakes it can save. It does the math for quick and correct numbers.
You might wonder why getting it right is so big a deal. Well, knowing your inventory affects how much money you think you made. And that’s important for any business!
Want to keep track better? Use our tool! It’ll show where things stand with neat results on ending inventory and turnover.
Using different ways to value your goods? Remember FIFO, LIFO, WAC – they all work with our calculator too.
Give our tool a try today! Watch as it makes keeping up with your stock simple and smart.
FAQs
1. Why do retail stores need to know their ending inventory?
Retail stores need to know their ending inventory so they can understand what products they have left, plan for future buying, and make sure their financial reports are right. This info also helps them spot if items are missing or if they have too much stock.
2. Can inventory management software help track my business’s inventories better?
Yes! Inventory management software can greatly improve how you keep track of your items by automatically updating when things are bought or sold, helping plan for demand forecasting, and cutting down on errors from manual counts.
3. How does first-in, first-out affect my business’s taxes?
The first-in, first-out method means that the oldest items in your stock get sold first; this could lead to higher taxes if prices go up over time because it shows more profit margin in your books than selling newer ones at possibly lower costs.
4. Is there a simple way to calculate my store’s current ratio using inventories?
Sure! To calculate your store’s current ratio, which shows whether you can pay off debts, divide all current assets, including inventories, by all short-term liabilities; a higher number means better financial health.
5. Does how I report my finished goods’ carrying values matter in financial reporting?
Absolutely! Reporting the correct carrying values of finished goods gives investors and others looking at your cash flow statement or balance sheet a true picture of what those items are worth; it’s crucial for showing accurate profits and company strength.
Related Calculators: