A confidence interval is a statistical concept that provides a range of values within which a population parameter, such as the mean or proportion, is likely to fall with a certain level of confidence. With our easy-to-use calculator, you will be able to find the confidence interval in no time. Just follow the instructions mentioned on the tool.
RESULTS
What Is A Confidence Interval?
A confidence interval is like a net for catching the true value of something you’re trying to measure. Imagine you want to know the average height of a group of people, but can’t ask everyone in the world. In other terms, a confidence interval is the level of uncertainty in any type of calculation within any particular statistics.
So, you pick just some people and find their average height. The confidence interval tells you where the real average height for all the people might be if you had asked them all.
It’s made up of two parts: where the range starts (the lower bound) and where it ends (the upper bound). You are pretty sure—like 95% sure—that the true number is somewhere between these two numbers.
This 95% is called your confidence level, and it means that if we could do this many times, about 95 out of 100 nets would catch that true value inside.
To get this interval, math folks use things like standard deviation and sample size from your small group to figure out how big or small that net should be. These give us clues about how much we can trust our little sample’s average to represent everybody else too!
Significance and Interpretation
Confidence intervals help us understand how sure we are about an estimate. Think of them like a net that catches the likely true value of what you’re studying. They show where the real answer might be, based on your sample data. If you have a wide interval, you’re less sure about where the true value is. But if it’s narrow, you can be more confident that you’re close to the mark.
Interpreting confidence intervals needs careful attention because they are not just simple ranges. They give us important clues about our data and what to expect from further studies or surveys.
For instance, if we take many samples and build confidence intervals using those samples, we expect most of these intervals will contain the actual population mean. This idea is crucial in making smart decisions in fields like economics and health sciences because it helps predict future outcomes with some level of certainty.
Confidence Interval Calculator Functionality
Here is how you can use our Confidence Interval Calculator.
Calculation of Lower and Upper Bounds
Confidence intervals give us a range where we can expect to find the true average of something. Our Confidence Interval Calculator is a tool that does this math for you. Here’s how it figures out the lower and upper bounds:
- First, you plug in your sample mean (x̅). This is just the average of all the numbers you’ve collected.
- Next, add the sample standard deviation. That’s a number that tells you how spread out your data is.
- You also need your sample size (n), which is how many pieces of data you have.
- Choose a confidence level, like 95%. It says how sure you want to be about your interval.
- The calculator uses all this to find the standard error of the mean. It’s like an estimate of uncertainty in your mean.
- Then, it checks the z-score or t-score, depending on your sample size. These scores match up with your confidence level on a chart.
- With these scores, it calculates the margin of error. It shows how much your mean could swing up or down.
- Finally, subtract and add this margin of error from your sample mean to get the lower and upper bounds.
Standard Error and Z-Score Calculation
Calculating the standard error and Z-score is a key step in finding confidence intervals. These numbers help us understand how much a sample statistic might differ from the actual population value.
- Find the population standard deviation or estimate it from your sample.
- Decide on your confidence level, like 95%.
- Look up the Z-value that matches your confidence level using a Z-table.
- Divide your population standard deviation by the square root of your sample size to get the standard error (SE).
- Multiply the SE by your Z – value to find out how big your margin of error is.
Margin Of Error
The margin of error tells us how much we can trust our survey data. It’s like a buffer around our results, showing how much they might change if we did the survey again. We find this number by looking at the standard error and using what statisticians call a Z-score. It helps us be more sure about where the true answer lies.
To get the margin of error, you take half of the width of your confidence interval. This step is important because it shows how confident you are in your results – whether they’re about people’s opinions on a new product or what kind of grades students are getting in class.
You multiply that Z-score by the standard deviation to see just how far off your sample might be from everyone else.
This math tool is powerful and can make you feel sure when you’re making big decisions based on numbers from surveys or experiments. Knowing your margin means knowing your limits—it keeps everyone honest about what those numbers really mean!
Confidence Interval Formula
Here is the formula for the Confidence Interval:
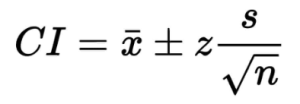
The Notation Is As Follows:
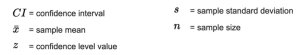
Components and Calculation
To figure out a confidence interval, you need some parts. These are the sample mean, standard deviation, and size of your group. Put these together with a z-score or t-score that fits how sure you want to be about your answer.
This score changes if you’re more or less certain. Like, if you want to be 95% sure, your z-score is different than if you wanted to be 99% sure.
Next comes the math. Multiply the standard error by your chosen z-score or t-score to get what’s called the margin of error. The standard error depends on your sample’s standard deviation and size.
Adding and subtracting this margin from your sample mean gives you the lower and upper limits of your confidence interval. Now you know where between those two numbers the real average might be for everyone, not just who was in your study!
Step-By-Step Manual Calculation
Calculating confidence intervals by hand can deepen your understanding of the formula components. Follow these steps for manual computation:
- Find the sample mean (the average of your numbers).
- Calculate the standard deviation to understand how much your data varies.
- Determine the size of your sample (how many data points you have).
- Use a standard normal distribution or t-distribution chart to find the z-score or t-value that matches your desired confidence level.
- Compute the standard error by dividing the standard deviation by the square root of the sample size.
- Multiply the z-score or t-value by the standard error to get the margin of error.
- Add and subtract this margin of error from your sample mean to get the lower and upper limits of your interval.
Example of Confidence Interval Calculation
Here are some examples of Confidence Interval Calculation.
Illustrative Example With 95% Confidence Level
Let’s learn how to calculate a 95% confidence interval through an example. Imagine we want to understand the average height of sunflowers in a large field.
- First, select a random sample of sunflower heights from the field.
- Record the heights and use them to figure out the average, which is our sample mean.
- Now calculate the standard deviation. This tells us how much the heights differ from each other.
- Decide on your confidence level, in this case, 95%. This means we are 95% sure our interval will have the true mean.
- Use a standard deviation calculator or table to find the z – score linked with your chosen confidence level.
- With this z – score, you can work out the margin of error by multiplying it with the standard error (the standard deviation divided by the square root of your sample size).
- Add and subtract this margin of error from your sample mean. These are your lower and upper bounds.
- The lower bound would be 175 – 7 = 168 cm.
- The upper bound would be 175 + 7 = 182 cm.
FAQs
Question: Why Is The P-Value Important In Finding A Confidence Interval?
The p-value helps you see if your results could happen by chance or if they show something real about what you’re studying, like how likely it is that the null hypothesis is false.
Question: Can I Use This Calculator For Different Types Of Data?
Yes, whether your data follows a normal distribution curve, t-distribution, chi-squared distribution, or binomial distribution, you can use a confidence interval calculator.
Question: How Does A Student’s T-Distribution Fit Into Calculating Confidence Intervals?
When you don’t know much about your whole group but have a small sample size, Student’s t-distribution helps provide more accurate intervals because it takes into account degrees of freedom.
Question: What Do Significant Figures And Decimal Places Have To Do With My Calculation?
Significant figures and decimal places tell us how exact our prediction interval will be when we write down our calculation results. More significant figures mean more exactness.
Question: Does The Time Frame Matter When Using A Confidence Interval Calculator?
Yes! The time frame matters because it affects random sampling; knowing when and how long data was collected helps ensure validity in estimating parameters within any given scope.