Conducting a survey and unsure how precise your results are? The margin of error is what stands between confidence in your data and potential missteps. With our easy-to-use calculator, you can find all the information you need without any problems!
RESULTS
Discover the ease of using a margin of error calculator to ensure accuracy in your findings. Stay informed and make smarter decisions by mastering this critical tool.
Understanding Margin Of Error
Grasping the concept of margin of error is pivotal for analyzing survey data; it provides a snapshot of how much you can expect your survey results to reflect the true perspective of your target population.
This statistical metric is not just about numbers—it’s a crucial gauge of precision, casting light on the confidence we can place in our collected data and shaping decisions based on those insights.
Definition And Purpose
The margin of error helps us know how close the results from a survey might be to the real answer for everyone. It tells us about how much we can trust what the survey says. Imagine you ask some people what their favorite ice cream is, and most say chocolate.
The margin of error shows how likely it is that chocolate really is the top pick if you ask everybody in town, not just those few people.
Knowing the margin of error matters because it changes how much confidence we have in our survey data. If we believe our findings are precise, we can make decisions more boldly. This piece of math magic isn’t just guessing; it uses cool formulas like MOE = Z * √P * (1 – P) / √N to give us a number that guides us on how strong our results are.
Next up: why this matters when looking at loads of survey answers!
Importance In Survey Data
Understanding the margin of error is like having a superpower in survey data. It tells you how much you can trust what people say in a poll or study. Picture this: You ask a group of friends which ice cream flavor is the best, and most say “chocolate.” If you only asked five friends, can you be sure everyone at school would agree? Probably not.
That’s where margin of error comes into play. It acts as a buffer to show that your results might be close but not exactly right.
Think about when companies want to know what toys kids will love next Christmas. They use surveys to figure out what’s hot and what’s not. But they need the margin of error to make sure their guess isn’t way off.
A small mistake could mean loads of unsold toys! Getting it right means understanding how many people to ask (sample size) and being really sure (confidence level). This helps them hit the target more often than missing it, making their research powerful and useful for planning ahead.
How to Calculate Margin of Error
Calculating the margin of error is a critical step to ensuring your survey data reflects a true picture of your target population. This process involves precise mathematical practices that translate abstract concepts into valuable, actionable metrics for any scientific study or market research initiative.
Using The Margin Of Error Formula
To use the margin of error formula, you pick a z-score based on your confidence level. This score tells you how sure you want to be about your results. Then, plug in the sample proportion (P) and the number of people who answered your survey (N).
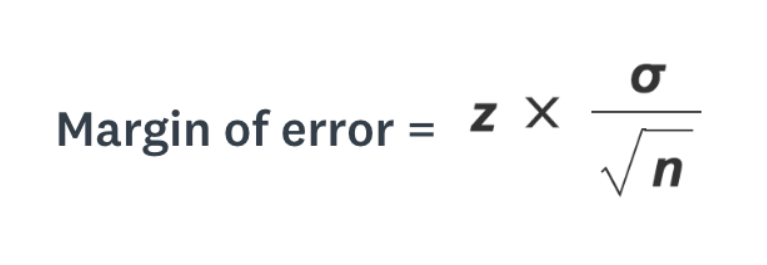
The Terminology Is As Follows:
- n= sample size
- σ= population standard deviation
- z= z-score
The basic formula looks like this: MOE = Z * √P * (1 – P) / √N. You’ll find that as N gets bigger, the margin of error gets smaller. That means with more survey answers, you can trust your results more.
Sometimes surveys are about everyone who could answer a question – that’s your population size. When we know this number and it isn’t too big, we tweak our formula so it’s even better at guessing what everyone thinks.
We call this adjustment “finite population correction.” It gives us a new way to figure out the margin of error: MOE = z * √p * (1 – p) / √(N – 1) * n / (N – n). Your calculator will help you step by step through these numbers for an accurate measure before moving on to calculate factors affecting the margin of error.
Step-By-Step Guide for Using the Calculator
Understanding how to calculate the margin of error is crucial for your surveys. Now, let’s make it simple with a calculator that does the math for you.
- Choose a confidence level that fits your survey need. Common levels are 90%, 95%, and 99%.
- Determine the proportion percentage (P) of your target outcome. If unsure, use 50% as a safe guess.
- Enter your sample size (N), which is the number of responses or observations in your survey.
- If you know your total population size, include this number; if not, the calculator can still work without it.
- Look up the Z-score that matches your chosen confidence level from a Z-table or use one provided by the calculator.
- Input all these values into the margin of error calculator fields: confidence level, proportion percentage, and sample size.
- The calculator will use this formula: MOE = Z * √P * (1 – P) / √N to compute your margin of error instantly.
- Review the result to understand the range within which the true value lies for your total population.
Factors Affecting Margin of Error
Here are some of the factors that affect the margin of error.
1. Confidence Level
Confidence level tells you how sure you can be about your survey data. It’s a key part of figuring out the margin of error. Think of it as a measure of trust in your results. If you choose a 95% confidence level, it means that if you did your survey 100 times, the results would match up 95 times out of those 100.
Higher confidence levels mean you believe more in your data, but they also make the margin of error bigger.
Picking the right confidence level is like choosing how strong a net should be when walking across a high wire; it’s all about how much risk you’re willing to take with your findings.
Your choice affects how wide or narrow your margin of error will be and changes what you can say about the whole population from just looking at your sample. Remember, using our example problem with a set confidence level gives us control over our calculations and helps predict what could happen beyond just our surveyed group.
2. Proportion Percentage
Proportion percentage is a big deal in margin of error calculations. It shows what part of your survey replies can swing one way or another. Say you’re looking at how many people like chocolate ice cream in your city.
If 30% do, that’s your proportion percentage. But not everyone has the same taste, so there’s some wiggle room – and that’s where the margin of error comes into play.
To get a good margin of error number, you need to know this proportion percentage first. It helps figure out how much trust you can put in your survey numbers when talking about everybody, not just the folks who answered.
Understanding this part makes sure you don’t make mistakes about what most people think or feel based on the answers from just some people.
3. Sample Size
Sample size is a big deal when figuring out the margin of error. Think of it like this: if you ask more people, you can be surer about your survey results. A larger sample size means your estimate will likely be closer to what most people really think or do.
But there’s a catch! You don’t always need to ask everyone in your target market to get good data. There’s a sweet spot where you’ve asked enough people to trust your results but not so many that it’s too much work or money.
It’s important for students like you to know how sample sizes change the certainty of your findings. With tools like the sample size calculator, getting this right becomes easier and helps make sure surveys are useful without wasting resources.
4. Population Size
Just as choosing the right number of people to include in a survey is vital, knowing how many people you could have asked is also key. This is where population size comes into play.
Population size matters because it tells us about the whole group that we want to learn about. If this group, or population, has lots of members, we may need more data for our results to be strong.
Our margin of error calculator uses the population size to make sure the margin of error works well for every survey. For example, if your study looks at what all students think about homework and there are 1,000 students at your school, then 1,000 is your population size.
The bigger this number gets, the harder it can be to get answers from everyone. But don’t worry if you can’t ask all 1,000 students; with a good random sample and solid math tools like z-scores and confidence intervals, you can still find out what’s likely true for everybody.
You can combine our margin of error calculator with the Inflation Calculator to get even better results regarding surveys.
FAQs
Question: Why Is Knowing The Margin Of Error Important For My Survey?
Knowing the margin of error helps you understand how much you can trust your survey’s findings and if they really show what people think or do.
Question: How Does Population Standard Deviation Affect The Margin Of Error?
The bigger the population standard deviation, which means how spread out people’s answers are, the larger your margin of error will be for your survey.
Question: Does A High Level Of Confidence Make My Margin Of Error Bigger?
Yes, if you want to be more sure about your results (a high confidence level), this usually makes your margin of error get larger too.
Question: Can I Use A Margin Of Error Calculator For All Types Of Surveys?
You can use it for many kinds but it works best when you’ve picked people randomly for things like polls or social media surveys where responses are expected to follow normal distribution patterns.
Question: Will My Response Rate Change The Outcome When Calculating The MOE?
Yes, getting fewer answers (response rate) than expected means there might be more chance that random sampling didn’t quite capture everyone’s attitudes correctly, possibly affecting the statistical significance.